I have a source of data that is formatted as below:
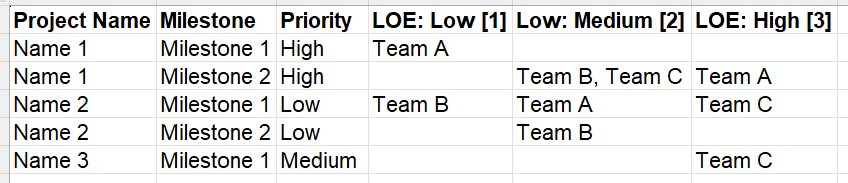
Representing a list of projects, milestones for each project, and the priority of the project. Then in the “LOE:” each team is essentially tagged in the column matching what that team’s level of effort required to complete the specific milestone is.
Using Fibonacci sequence were low is worth 1, medium is worth 2, and high is worth 3; the end result I’m looking to produce is:
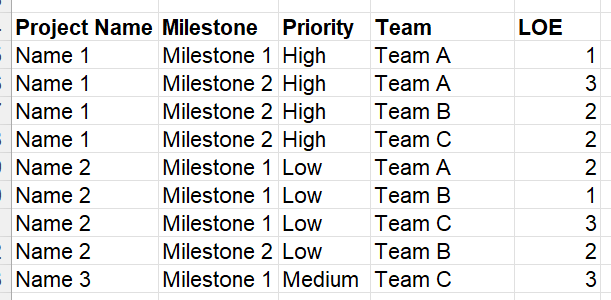
From there I’m pretty confident I can pivot the data easily for any other purpose, but I’m struggling with the most efficient way of getting from the original data to how I want it formatted. I was thinking of using PowerQuery’s spilt text to rows feature but it becomes complicated with the 3 LOE columns.