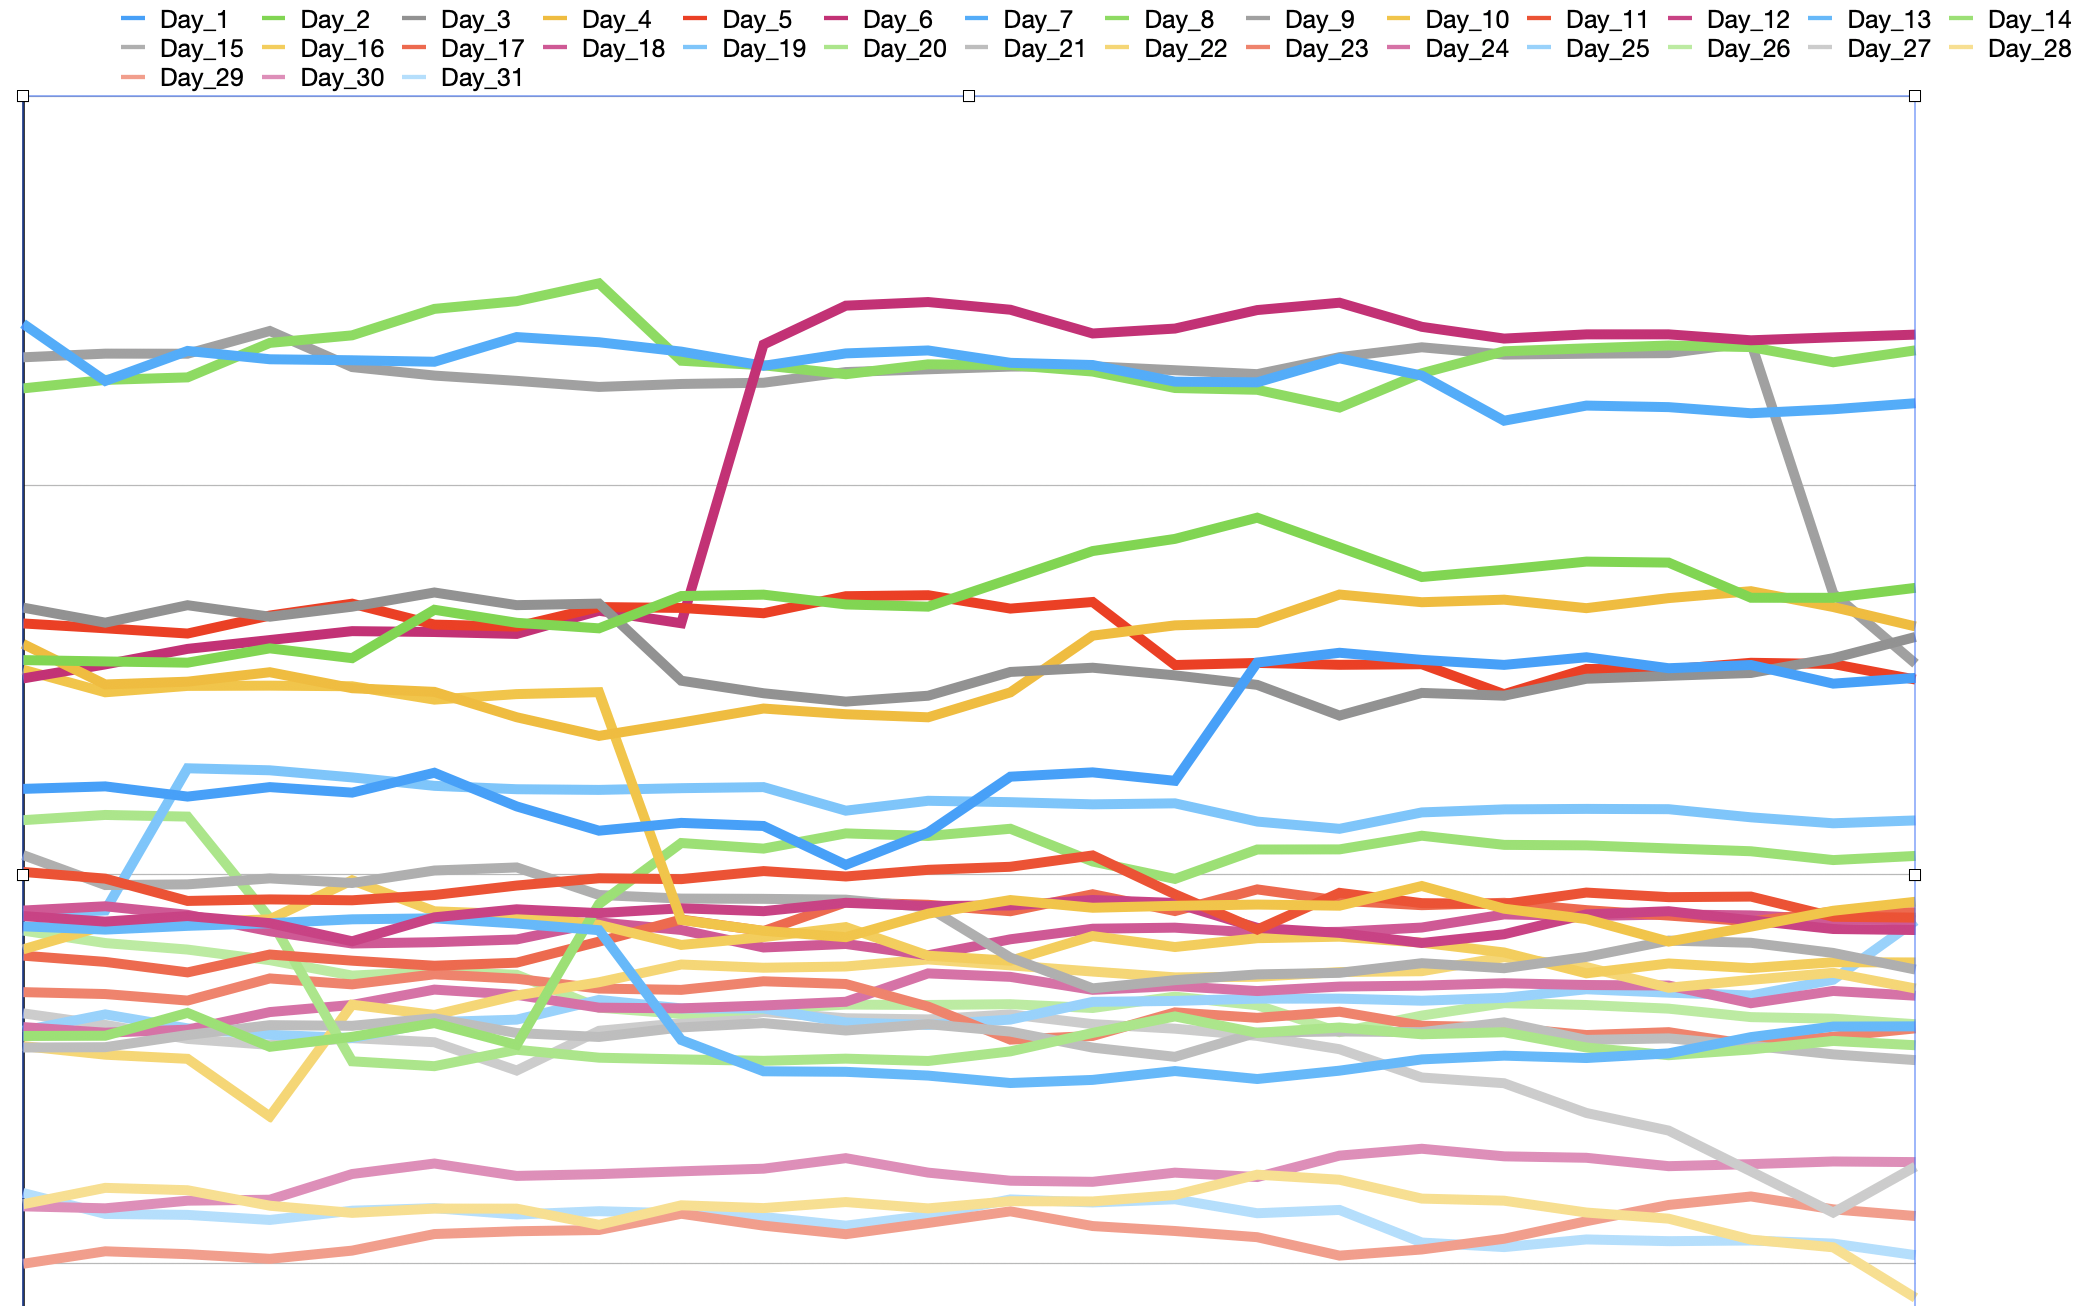
I have a spreadsheet in Numbers that has a column of data for each day of a month. If I plot the data with a line chart, I get a series of lines that cycles through six different colors (see an example below). It would be very helpful to have a cycle of seven colors, to match the seven-day week. I know I can edit the chart after it is generated and change the color of each series by hand, but that is very tedious and error-prone.
So, is there a way to control the automatic assignment of colors? I couldn’t find anything under the chart controls or in the preferences.
In case it’s relevant, I’m using Numbers version 11.2 with macOS Big Sur.
