Probably a simple question, but I can’t seem to find the answer anywhere.
I have a map chart in Excel (2024) with quite a diverse amount of data, like in the following image:
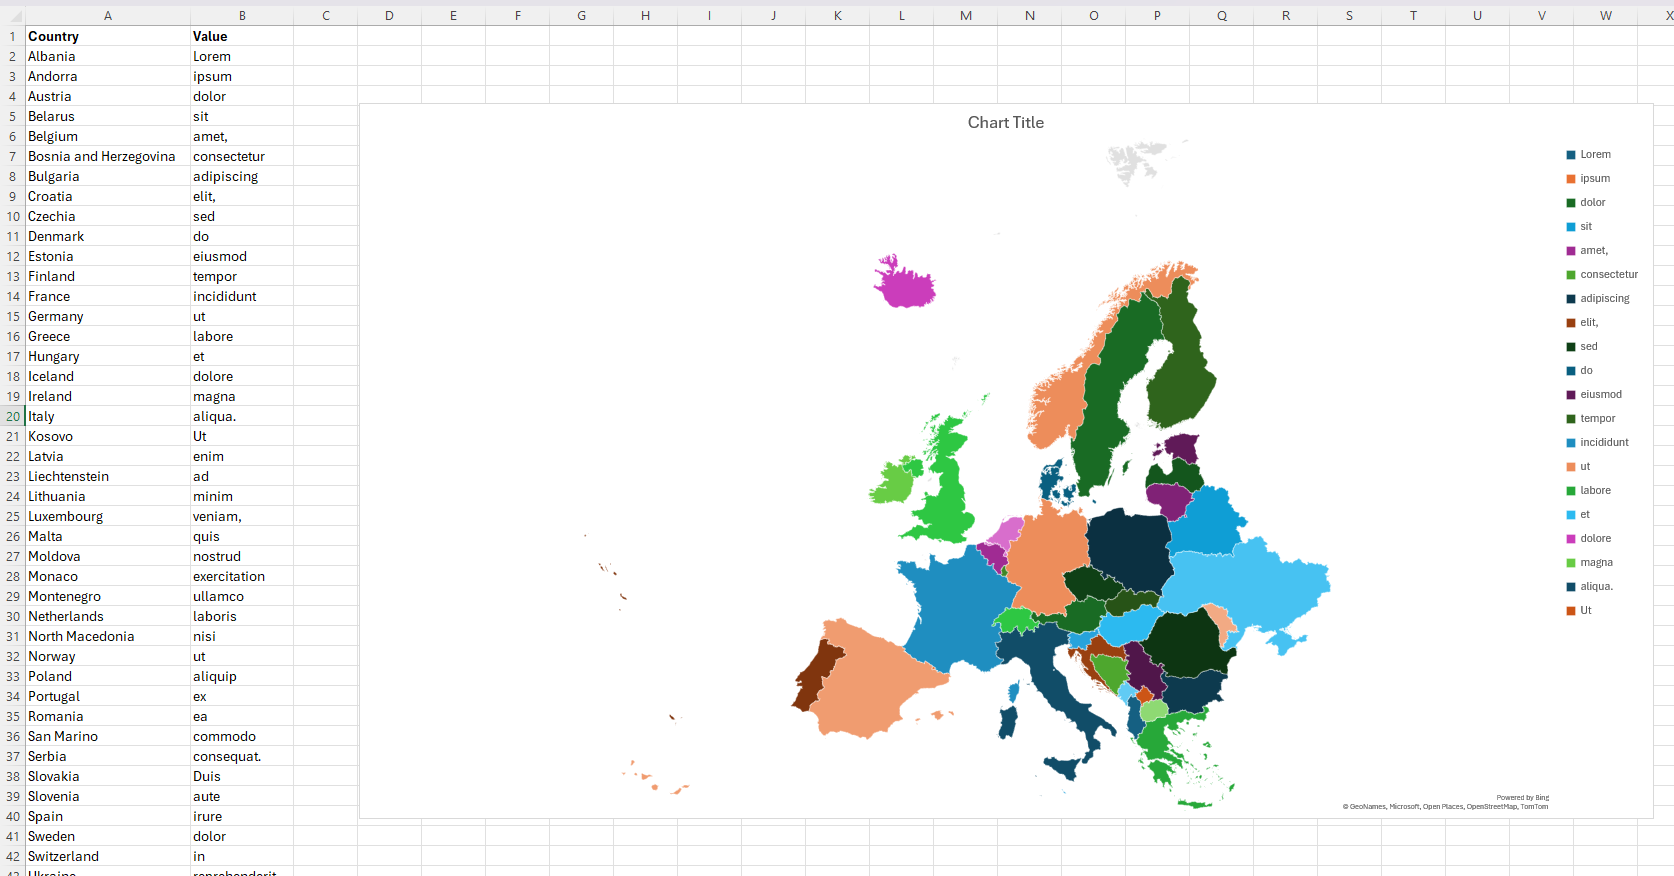
The key on the right, no matter what I do, only shows the first 20 values in the dataset. Unfortunately, as you can see, I have more than 20 different unique values.
How do I get it to show all the values?