I have been scratching my head trying to figure out how to produce a statistic table as formulated in the attached picture:
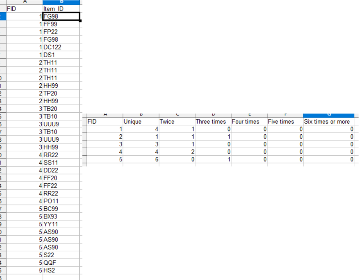
I have about 670k objects (Item_id) divided between around 1000 IDs (FID) and I need to produce a table to show for each ID how many objects appear once, twice, three times, four times, five times or six times or great.
What I have is:
FID Item_ID
1 TH22
1 Th2
1 Th9
1 TH22
2 TH3
2 TH22
2 TH99
So at the end (this very small example) it sould look like:
ID Once Twice Three times Four Times Five Times Six Times or greater

1 2 1 0 0 0 0
2 3 0 0 0 0 0
I think Excel can do this but it might be I need to use R or SQL. But I would really appreciate any ideas and some instructions of how to go about producing this table.
I wish everyone well
