I am generating a scorecard with the KPIs being scored from a scale of 1 – 5, 5 being the highest and 1 as the lowest. One of the KPIs is billable hours and I have a dataset from billable hours from last year and Q1 of this year. The mean of the data set is 60 and the standard deviation is 30. I can’t figure out what values to assign between 1 – 5 to ensure a normal distribution in a bell curve. Would appreciate if the excel formula is provided. I’m not very good in statistics and math but I can figure it out with an explanation and samples. Thanks!
You may also like

After a couple hours of trying everything I could, I’m posting the question here. I’m trying to run this python script which […]

Discover how AI tools like CursorAI are transforming iOS development, with practical tips and real-world examples for balancing AI assistance with developer […]
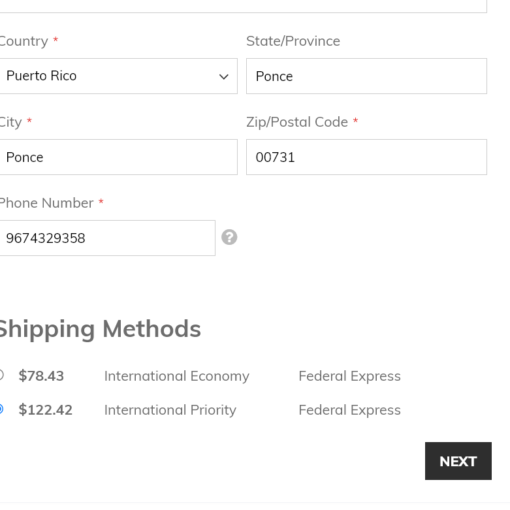

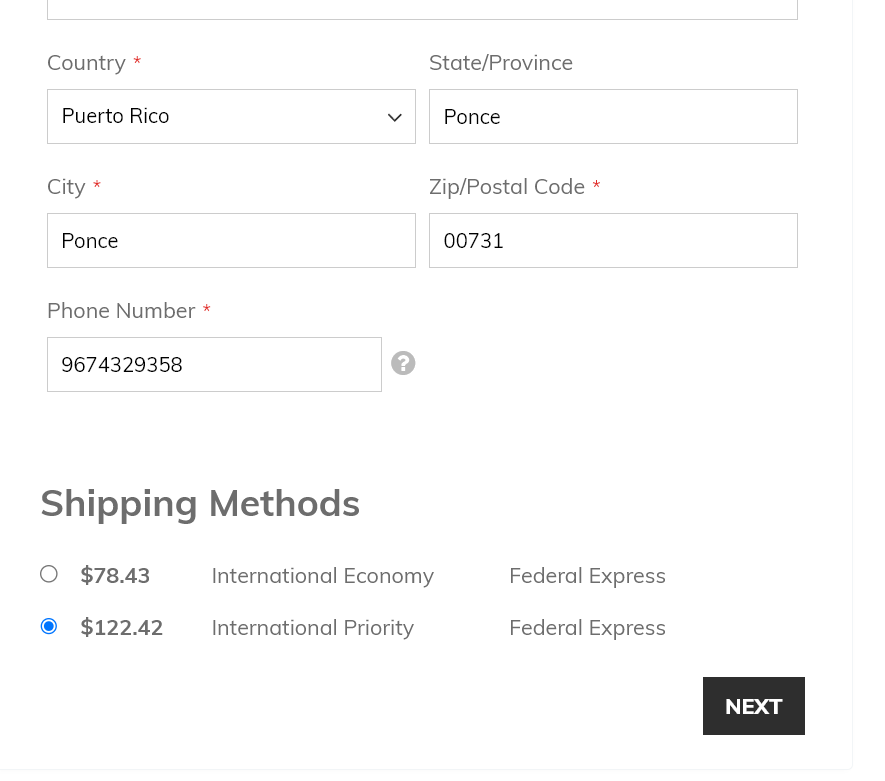
The shipping section doesn’t display a new set of delivery methods when country is changed. The methods seen in the image below […]
So I had a bug in some code where I was doing an array_udiff() on arrays of arrays, thinking the callback function […]