x-Axis formatted for date in both data pull and in the chart, yet the dates are all coming up with the wrong year. All are ending in 00 instead of the correct year 19. Data range for x-axis is date (m/dd/yy) with dates such as 1/6/19, 1/13/19 etc, however the x-axis is charting as 1/1/00, 1/2/00. Why?
You may also like
Mage Mojo, a leader in Magento hosting, has announced an upgrade to the new 12th Generation Servers from Dell that can increase […]
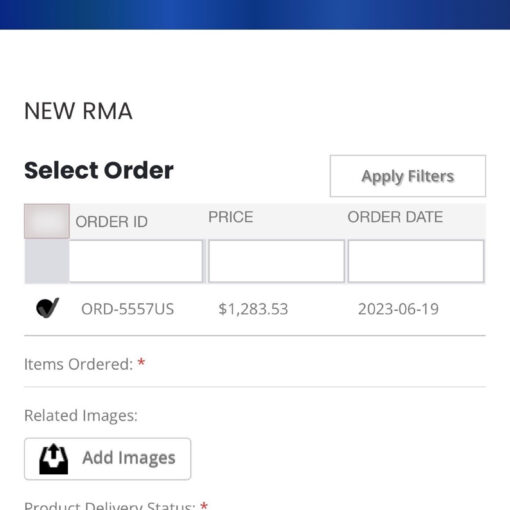
We are using an RMA module which let the customer select a new return for their purchased item. When clicking on the […]
i want to create luma based theme and set up grunt for it. path to .less files: frontend///web/css/source/style-l.less im getting an error: […]
I have a product in which final price is determined by a choice of a set width option plus a choice of […]

