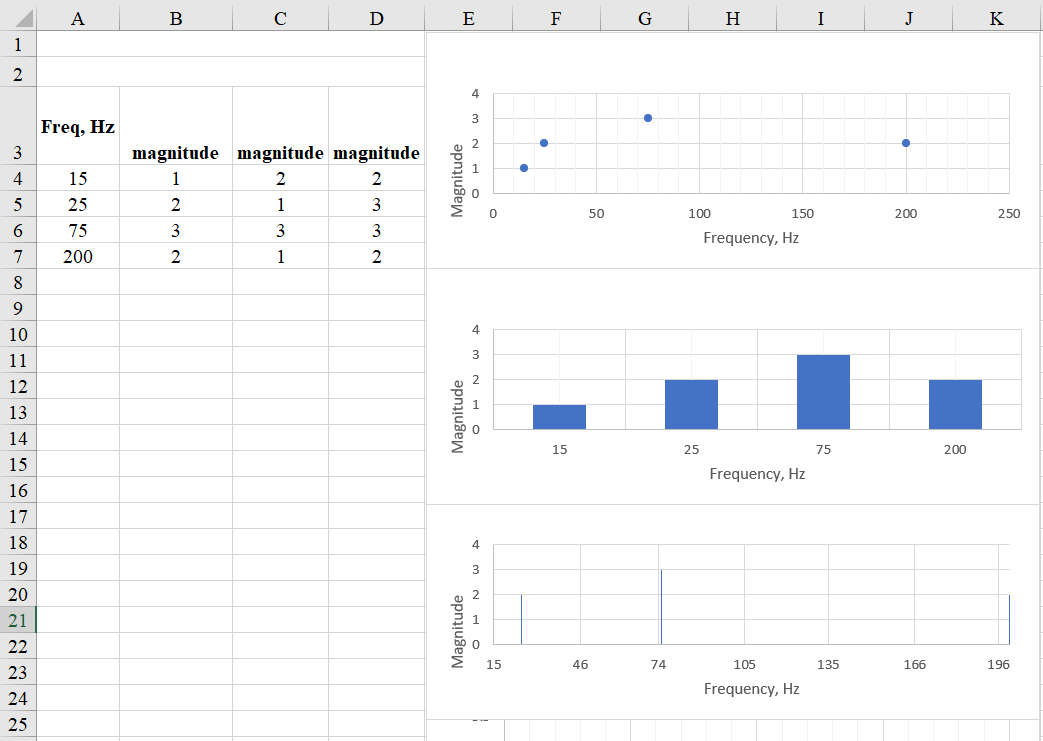
I would like to produce a chart that looks kind of like a bar graph, except the bars (thin lines would be fine, too) would be placed at their actual location respective to the axis. I am well aware bar graphs and xy scatter charts are completely different. It is the look of xy scatter chart I am trying to change.
It would be nice to be able to customize what it is that connects vertically from horizontal axis to each data point: whether it be a wide bar, an arrow, or a thin line. And also whether to show a dot at the data location or not would be nice to be able to specify.
So, what would this be even called, and how do I accomplish this? THANK YOU FOR HELP!!!
Chart on bottom is close to what I need:

