
With Gatsby, it’s very easy to integrate different data sources into one application. In this article, we’ll develop a task management tool whose data is fetched from Airtable. We’ll use React for the front end, with a hybrid rendering strategy.
It’s a common scenario: you want to develop an app that connects to data from a spreadsheet application or some other data source. In this article, I’ll show you how to implement an application of this type with the Gatsby framework. In our example application, tasks will be imported from an Airtable workspace and visualized as a Gantt chart. The user can move the tasks by drag and drop, after which all changes will be synchronized with Airtable. You can use the project as a template for all kinds of scheduling apps.
You can try the result live on my Gatsby Cloud site. The src files of the project can be found in my GitHub repository.
Setting Up the Project
Gatsby is a static site generator. This means you write your application with React, and Gatsby translates your code into HTML files that are understandable to the browser. This build process is carried out at regular intervals on the server side, in contrast to conventional web applications where the HTML code is first assembled on the client side in the user’s browser. The HTML files are therefore statically available on the server (hence the name static site generator) and can be sent directly to the client when requested. This reduces the loading time of the application for the user.
SitePoint’s Gatsby tutorial provides all the information you need to develop an application with this framework. If you want to develop my example application step by step, you should start as outlines below.
First, you should download and install Node.js. You can check if it’s installed correctly by typing node -v on the console. The current version of Node should be displayed:
node -v
> v14.16.0
With Node we also get npm, the Node package manager. With this tool, we can now install the Gatsby CLI:
npm install -g gatsby-cli
We’re ready to create a new project using the Gatsby CLI. I name it “gantt-chart-gatsby”:
gatsby new gantt-chart-gatsby
Then move into the project folder with the command cd gantt-chart-gatsby and build the project with the command gatsby develop. Now you can open the index page of the project in the browser on http://localhost:8000. At first, you should only see the welcome page that Gatsby has prepared for us.
In the next step, you should examine the src folder of the project. The subfolder src/pages contains the React components of the individual pages of the project. For now, it’s sufficient for you to keep the index.js file for the index page, because, in our example application, we only need one page. You can delete the other files in this folder, except for 404.js (which can be useful if someone enters a wrong address).
It’s a good starting point if you overwrite the existing code in index.js with this code:
import * as React from 'react'

const IndexPage = () => {
  return (
   <main>
      <title>Gantt Chart</title>
      <h1>Welcome to my Gatsby Gantt Chart</h1>

    </main>
  )
}

export default IndexPage;
You can build the project again with the command gatsby develop on the command line and open the index page in the browser. Now you should see an empty page with the heading “Welcome to my Gatsby Gantt Chart”.
Building the Front End with React
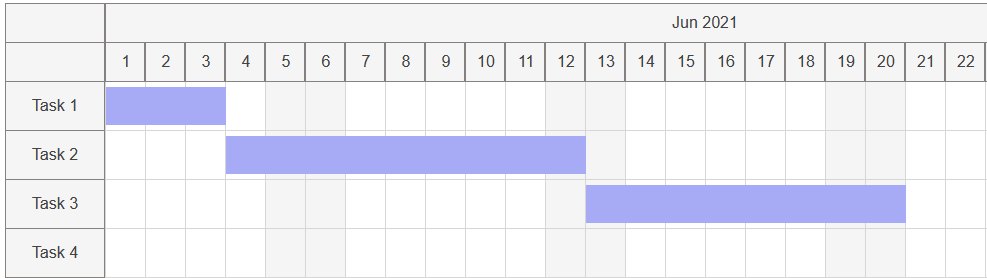
The first version of the index page
We will implement the Gantt chart as a reusable React component. Before I explain the implementation of the component in detail in the following sections, I’d first like to show how it’s initialized and embedded in the index page. So I’d recommend you to hold off using the gatsby develop command until we’ve finished the first version of the component. (I’ll let you know when we’re ready!)
In this example project, I use the concept of “jobs” and “resources”. Jobs are the tasks that are drawn into the chart cells and that can be moved by drag and drop. Resources contain the labels for the rows in which the jobs can be moved. These can be names for the tasks, but in other use cases also the names of people, vehicles or machines carrying out the tasks.
Jobs and resources are passed to the Gantt chart component as properties. Before connecting the task management tool to Airtable, we fill the lists with some hard-coded test data in JSON format:
import * as React from "react";
import {GanttChart} from "../GanttChart";
import "../styles/index.css";

let j = [
  {id: "j1", start: new Date("2021/6/1"), end: new Date("2021/6/4"), resource: "r1"},
  {id: "j2", start: new Date("2021/6/4"), end: new Date("2021/6/13"), resource: "r2"},
  {id: "j3", start: new Date("2021/6/13"), end: new Date("2021/6/21"), resource: "r3"},
];

let r = [{id:"r1", name: "Task 1"}, {id:"r2", name: "Task 2"}, {id:"r3", name: "Task 3"}, {id:"r4", name: "Task 4"}];

const IndexPage = () => {
  return (
    <main>
      <title>Gantt Chart</title>
      <h1>Welcome to my Gatsby Gantt Chart</h1>
      <GanttChart jobs={j} resources={r}/>
    </main>
  )
};

export default IndexPage;
CSS styles for the Gantt chart
In the next step, we create a new index.css file in the styles folder. (If the folder doesn’t exist, create a new folder styles in the folder src of the project.) The following CSS settings control the layout and appearance of the Gantt chart:
body{
  font-family: Arial, Helvetica, sans-serif;
}

#gantt-container{
  display: grid;
}

.gantt-row-resource{
  background-color:whitesmoke;
  color:rgba(0, 0, 0, 0.726);
  border:1px solid rgb(133, 129, 129);
  text-align: center;
  padding: 15px;
}

.gantt-row-period{
  background-color:whitesmoke;
  color:rgba(0, 0, 0, 0.726);
  border:1px solid rgb(133, 129, 129);
  text-align: center;

  display:grid;
  grid-auto-flow: column;
  grid-auto-columns: minmax(40px, 1fr);
}

.period{
  padding: 10px 0 10px 0;
}

.gantt-row-item{
  border: 1px solid rgb(214, 214, 214);
  padding: 10px 0 10px 0;
  position: relative;
  background-color:white;
}

.job{
  position: absolute;
  height:38px;
  top:5px;
  z-index: 100;
  background-color:rgb(167, 171, 245);
  cursor: pointer;
}
Implementing the GanttChart component
Now I’ll explain the implementation of the GanttChart component in more detail. First, we need a file named GanttChart.js in the src folder. In this tutorial, I use a simplified version of the GanttChart for only one month (June 2021). An extended version with select fields for starting month and end month can be found at GitHub under the name GanttChart_extended.js.
The chart table is built up in three steps, represented by the functions initFirstRow, initSecondRow and initGanttRows:
import React from 'react';

export class GanttChart extends React.Component {

    names = ["Jan", "Feb", "Mar", "Apr", "May", "Jun", "Jul", "Aug", "Sep", "Oct", "Nov", "Dec"];

    constructor(props) {

        super(props);

        this.state = {
            dateFrom: new Date(2021,5,1),
            dateTo: new Date(2021,5,30),
        };
    }

    render(){

        let month = new Date(this.state.dateFrom.getFullYear(), this.state.dateFrom.getMonth(), 1);

        let grid_style = "100px 1fr";

        let firstRow = this.initFirstRow(month);
        let secondRow = this.initSecondRow(month);
        let ganttRows = this.initGanttRows(month);

        return (

            <div className="gantt-chart">
                <div id="gantt-container" style={{gridTemplateColumns : grid_style}}>
                    {firstRow}
                    {secondRow}
                    {ganttRows}
                </div>
            </div>
        );
     }


    initFirstRow(month){...}

    initSecondRow(month){...}

    initGanttRows(month){...}


    //helper functions:

    formatDate(d){
        return d.getFullYear()+"-"+this.zeroPad(d.getMonth()+1)+"-"+this.zeroPad(d.getDate());
    }

    zeroPad(n){
        return n<10 ? "0"+n : n;
    }

    monthDiff(d1, d2) {
        let months;
        months = (d2.getFullYear() - d1.getFullYear()) * 12;
        months -= d1.getMonth();
        months += d2.getMonth();
        return months <= 0 ? 0 : months;
    }

    dayDiff(d1, d2){
        let diffTime = Math.abs(d2 - d1);
        let diffDays = Math.ceil(diffTime / (1000 * 60 * 60 * 24));
        return diffDays;
    }

}
In the initFirstRow function, the first row of the chart table is generated. As you can see from the picture above, the first row consists of two grid cells. These are generated as divs, which in turn are inserted as children into the “gantt-container” (see the listing above). The second div also contains the label for the current month.
React requires a unique “key” property for all elements that are part of an enumeration. This helps to optimize the rendering performance:
 initFirstRow(month){

    let elements = []; let i = 0;

    elements.push(<div key={"fr"+(i++)} className="gantt-row-resource"></div>);

    elements.push(<div key={"fr"+(i++)} className="gantt-row-period"><div className="period">{this.names[month.getMonth()] + " " + month.getFullYear()}</div></div>);

    return elements;
 }
The next row of the chart table is generated in the initSecondRow function. We use the same principle again: for each table cell, a div is created. You have to make sure that the divs are nested correctly (the second div in the row contains individual divs for each day of the month) so that the CSS Grid settings (see the index.css file) will produce the desired layout:
initSecondRow(month){

    let elements = []; let i=0;

    //first div
    elements.push(<div key={"sr"+(i++)} style={{borderTop : 'none'}} className="gantt-row-resource"></div>);

    let days = [];

    let f_om = new Date(month); //first day of month
    let l_om = new Date(month.getFullYear(), month.getMonth()+1, 0); //last day of month

    let date = new Date(f_om);

    for(date; date <= l_om; date.setDate(date.getDate()+1)){

        days.push(<div key={"sr"+(i++)} style={{borderTop: 'none'}} className="gantt-row-period period">{date.getDate()}</div>);
    }

    //second div in the row with child divs for the individual days
    elements.push(<div key={"sr"+(i++)} style={{border: 'none'}} className="gantt-row-period">{days}</div>);

    return elements;

}
The remaining rows of the chart table are generated in the initGanttRows function. They contain the grid cells into which the jobs are drawn. Again, the rendering is done row by row: for each row we first place the name of the resource, then we iterate over the individual days of the month. Each grid cell is initialized as a ChartCell component for a specific day and resource. With the cell_jobs list, the individual cell is assigned the jobs that need to be drawn into it (typically this is exactly one job):
initGanttRows(month){

    let elements = []; let i=0;

    this.props.resources.forEach(resource => {

        elements.push(<div key={"gr"+(i++)} style={{borderTop : 'none'}} className="gantt-row-resource">{resource.name}</div>);

        let cells = [];

        let f_om = new Date(month);
        let l_om = new Date(month.getFullYear(), month.getMonth()+1, 0);

        let date = new Date(f_om);

        for(date; date <= l_om; date.setDate(date.getDate()+1)){

            let cell_jobs = this.props.jobs.filter((job) => job.resource == resource.id && job.start.getTime() == date.getTime());

            cells.push(<ChartCell key={"gr"+(i++)} resource={resource} date={new Date(date)} jobs={cell_jobs}/>);
        }

        elements.push(<div key={"gr"+(i++)} style={{border: 'none'}} className="gantt-row-period">{cells}</div>);

    });

    return elements;
}
Now add the following code for the ChartCell component at the end of GanttChart.js. The component renders a single table cell of the chart as a div containing one or more jobs as child elements. The HTML code for displaying a job is provided by the getJobElement function:
class ChartCell extends React.Component {

    constructor(props) {

      super(props);

      this.state = {
        jobs: props.jobs
      }
    }

    render(){

      let jobElements = this.props.jobs.map((job) => this.getJobElement(job));

      return (
        <div
            style={{borderTop: 'none', borderRight: 'none', backgroundColor: (this.props.date.getDay()==0 || this.props.date.getDay()==6) ? "whitesmoke" : "white" }}
            className="gantt-row-item">
            {jobElements}
        </div>
      );
    }

    getJobElement(job){

        let d = this.dayDiff(job.start, job.end);

        //Example: a job with a duration of 2 days covers exactly two grid cells, so the width is 2*100% and we have to add up 2px for the width of the grid lines
        return (
        <div    style={{width: "calc("+(d*100)+"% + "+ d + "px)"}}
                className="job"
                id={job.id}
                key={job.id}
        >

        </div>
        );
    }

    dayDiff(d1, d2){
        let diffTime = Math.abs(d2 - d1);
        let diffDays = Math.ceil(diffTime / (1000 * 60 * 60 * 24));
        return diffDays;
    }
}
At this point, you can build the project from the root folder using the gatsby develop command. The hard-coded jobs from the index page should be visible in the Gantt chart. They can’t be dragged and dropped yet, but we’ll take care of that later.
Continue reading
Build Interactive Gantt Charts with Airtable, Gatsby and React
on SitePoint.

