I have a worksheet that looks like this:
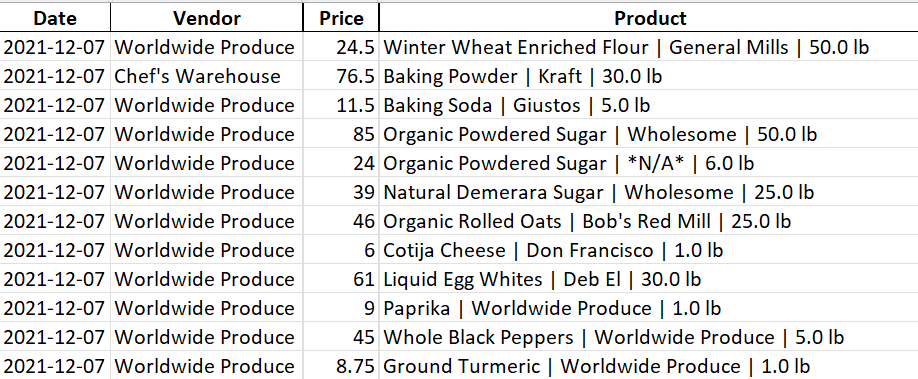
This is just a sample. The full sheet includes multiple dates and vendors. On a separate sheet I am trying to create a line chart with the following features:
- x-axis from
Datecolumn - y-axis from
Pricecolumn - Results filtered by
Productcolumn. A drop down menu allows user to select theProducthe wants to track. - Multiple lines (color coded with legend) for each
Vendorwith pricing data for the selectedProduct
As an example, see below. With the exception of a filter to select different products, this is basically what I am going for.

I have tried inserting a chart in multiple different ways, using recommendations, creating from scratch, etc. I have failed in all my attempts so far to build this out.
