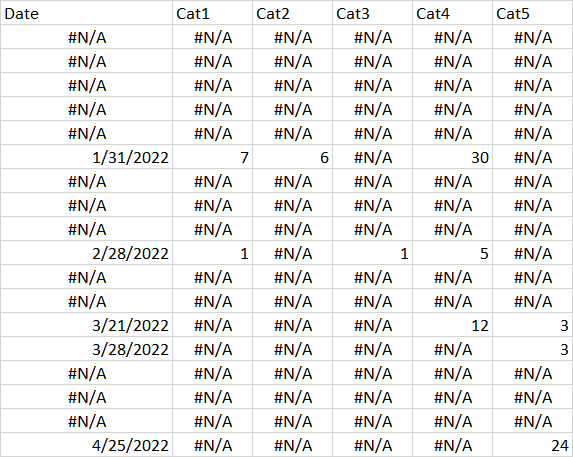
Can Excel hide columns in a chart when the columns have 0, empty, or NA value? I have data like this:
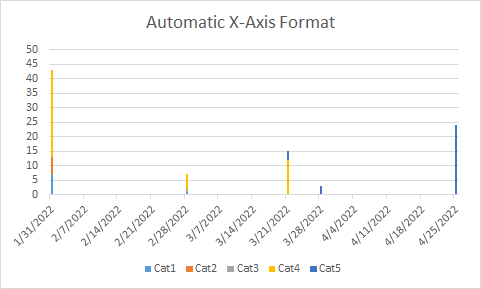
If I select all the data and insert a stacked column chart, I get the following:
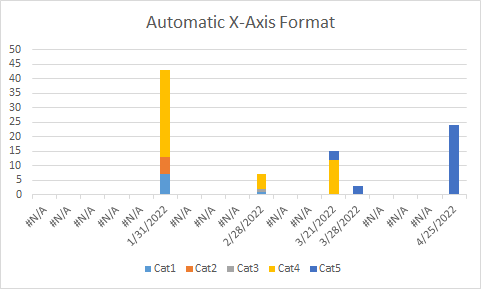
And if I change the X axis to Text instead of Automatic, I get this:
But I want all the NA columns to be hidden, like in the following:
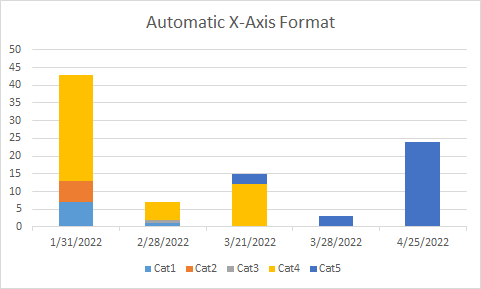
For the above chart, I went into Select Data and unchecked all the Horizontal Axis Labels that didn’t have a value. However, this is not a dynamic solution and I can’t check/uncheck the label for each date as data will be changing frequently. Can Excel collapse the labels that don’t have any value? I can reformat the Date and category values as needed, e.g. if an empty or 0 value is better than NA().

